How to Create Stunning Infographics
12:19 AMAs someone said, “A picture is worth more than 1000 words.” In the present scenario, a picture is a very good way to share and summarize your blog content. You can use chart, Information and text together to create an Infographic. Infographics are quite popular on Social-media sites & readers love it as it convey the message in an easy to understand format.
Most of the bloggers think that you need to be a highly skilled designer to create an infographic, which is not entirely true. These days there are many online Infographic maker sites are there to help users like you & me to create Infographics for our blog post. This is your handy guide to learn everything about designing Infographics for your blog even if you have not done it before.

First thing first: Let’s see what is Infographic?
Infographic is a visual representation of Information, data, and knowledge. They can be used to show patterns, timelines, and trends.
Earlier it was used in Newspaper and TV News channel, but Facebook, Twitter, and other social media made it a big hit for website and blogs to create a visual representation of information.For more details on Infographic, you can read Wikipedia.
Infographic can also be used to represent Public transit or local maps. Let’s see how creating infographic will help your blog:
- Helps you to summarize your blog content to a picture
- Easier for your readers to get the content quickly through Infographic
- Human brain process images much faster than text
- Get more traffic by sharing these pictures on social media
- Pinterest and Instagram love Infographic
- Helps you to make your content viral, Instead of sharing a plain picture

So now you have a basic idea about Infographic, let’s see how to create one for your blog post. There are various tools available online to create it quickly. You can always use software like Photoshop to create a customized Infographic for you.
Easy Tools for Bloggers to create Infographics:
Canva:
My personal favorite. It provides you free as well as paid template to create Infographic images. It has also inbuilt free pictures and illustrations to use in your Infographic.
Probably the best in the market.
Piktochart:
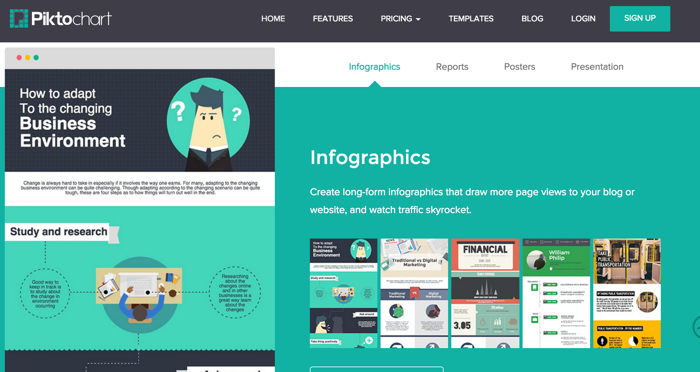
Piktochart is another popular Infographic maker tool that is free & offer paid solution too for advanced options. The only limitation of the free version is it let you create & download Infographic with the watermark. At the same time, a huge collection of free templates & pictures makes it a great tool for users like you & me.
Apart from above two, there are few more Infographic maker sites that I have listed below:
- Venngage
- Infogr.am
- Create.visual.ly
Best Practices for Creating Infographics that Rock

Do not just create Infographic for building backlinks. Try to solve a problem for your audience. Think how can this picture can help them. If a picture cannot impress you, it definitely will not impress others.Consider your target audience and entertain them.
Use sufficient icons and symbols to explain topics to your readers. Do not clutters the infographic with a lot of texts. People love to see symbols and signs.


Make sure you promote your Infographic using embed tweet or Click to Tweet. Use Pinterest and Instagram to make sure Infographic looks good.

Conclusion –

It takes a little time to create it but it helps you to generate more traffic to your post by making it viral. It can be easily shared on social media and tools available online to create it.
I hope this post would have given you the basic idea about Infographic, how to create them and best practices to follow. Please use the comments section to share your view.
0 comments